We tried to connect contracts, spending and beneficial ownership in the UK. It was tough and that needs to change

The demise of Carillion, and concerns over the health of Capita, two of the largest government contractors in the UK, make one thing clear: we just don’t know enough about who wins government contracts in the country.
Despite the UK’s commitment to transparency and efforts to publish contracting and spend data, data quality and completeness remain a problem. For example, only about 10 of Carillion’s 400 or more UK contracts have been reported on the main government database, Contracts Finder. After an expose by the Times revealed that 92 out of the 202 “transparency” publications that ministers had pledged to release were either late or missing. Theresa May wrote to departments at the end of last year to remind them of their obligations to publish better data and information.
Having real-time, public and standardised open data for all of the Government’s public procurement can help increase understanding of who buys what from whom, manage risk, spot dysfunctional markets, better advertise business opportunities, and monitor and flag questionable awards. That’s why we organised a data hack in London last month with more than 30 developers, data analysts, journalists and policy experts to look at the existing open data sets around the UK’s public procurement.
The two days revealed a lot about how the data and policies could be improved to help improve access and use of contracting information in the UK across government, business and civil society.
Why we need higher-quality data in the Open Contracting Data Standard

Overhauling the entire UK public procurement system is much overdue. Multiple systems are being used across local and central government for awarding contracts, tracking spending and managing performance. None of these systems talk to one another.
One of the values of using standardised open data is to connect across these silos. In fact, we were able to create one database to incorporate open data on government contracts, spend data, grants, company information and beneficial ownership, in collaboration with Crown Commercial Services, Spend Network, 360 Giving, OpenCorporates, and OpenOwnership, but it wasn’t easy.
Here are some the key challenges.
1) While the UK Government is following the Open Contracting Data Standard when publishing new contracting data in Contracts Funder, data entry can be poor and incomplete.
2) Another critical gap is unique identifiers. The lack of open, unique identifiers throughout spend and contract data makes it difficult and time-consuming to match them against Companies House data, for example. It should be mandatory for government buyers to publish unique open identifiers for suppliers. It’s not rocket science. Ukraine has done it.
3) Procurement is a complex area, and a data dictionary would be hugely helpful to explain the meaning of different terms mentioned in contracts and spending information as well as to navigate common errors found in the data set.
All three issues are solvable, though some require more resources than others. Creating standard spend categories and requiring councils and Government departments to use them is perfectly possible, as is better quality control. Not taking action blocks meaningful progress and impact on growth, innovation and anti-corruption and means when you have a disaster like Carillion, you have to scramble to catch up.
Spending patterns across different councils, government departments
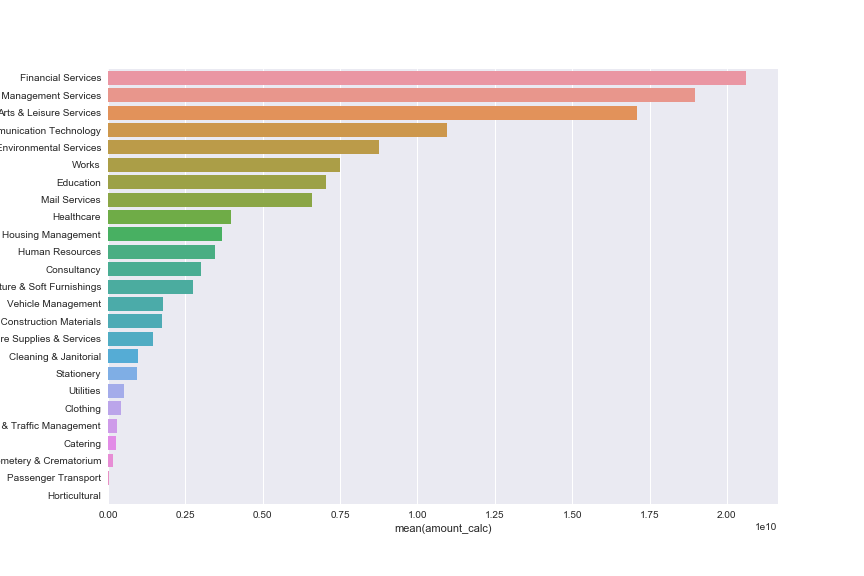
For the full picture of where local government put its priorities, you need to follow the money and look at the spending patterns. Our hack shows that variation was surprisingly high.
Financial services, facilities management, and arts & leisure services were the highest expenditure. A disaggregation of ‘Facilities Management Services’ shows that almost 57% goes to ‘market research.’ After ‘market research,’ ‘advertising’ and ‘security’ got the biggest spend.
The spending data shows that the East Midlands region had the least diverse spending pattern with £23 million going to repaying debt since 2010 and whereas South West had the most. Yorkshire and Humber spend far more on Facilities Management than North East or North West (see graph below).
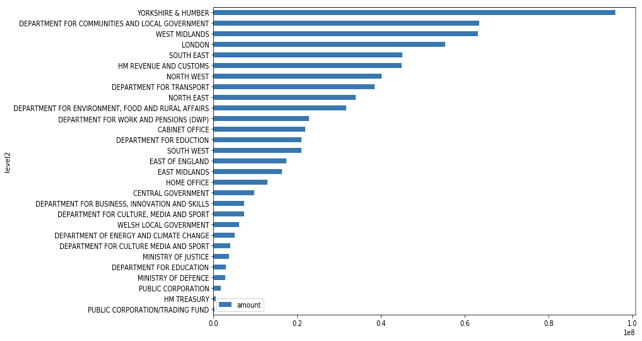
Our hack team used the Government’s spend dataset, and run statistical analysis on the spend amounts, market share and ‘experimental categories’ provided by Spend Network’s platform. Since the Government spend dataset is not categorised, Spend Network’s algorithm uses keywords mentioned in each transaction as well as combining information about the buyer (e.g. we know ‘KPMG’ is a financial services provider) to assign a category to that transaction. While this is an efficient way of categorising millions of rows of spending data, it has a significant margin of error. Councils and Government departments should propose official spend categories to avoid skewed analysis.
Some transactions stood out, and there was no way to find out more about them by looking at the provided data set. £971 million was paid out to “Coventry Building Society Charitable Foundation” by Derbyshire County Council over five years. A Google search revealed that the charity runs community projects across the West Midlands. The amount seems too high for community projects, so maybe it was a data entry error; should it have been Coventry Building Society rather than Coventry Building Society Charitable Foundation. Spend Network, and the hack team submitted an FOI request to get more clarity from the council.
Need to link contracts to its beneficial owners
There’s still a lot of work to do to understand better who benefits from public contracts. A critical component is the link to the beneficial owners of the private companies winning the deals.
When the 600 companies mentioned in Paradise Papers were matched against government contracts using Contracts Finder, four matches were found including Capita and Halcrow. There could be more if the subsidiaries of the Paradise Papers businesses were also run through the list of government contractors. This isn’t straightforward because spend data uses group company names such as ‘Halcrow’ rather than the exact subsidiary they are engaging with such as ‘Halcrow Holdings Limited’. The next step was to find the beneficial owners (or the real beneficiaries) behind those companies. They are both PLC’s so they are exempt from reporting beneficial owners but our team looked at the spread of the corporate networks through OpenOwnership.
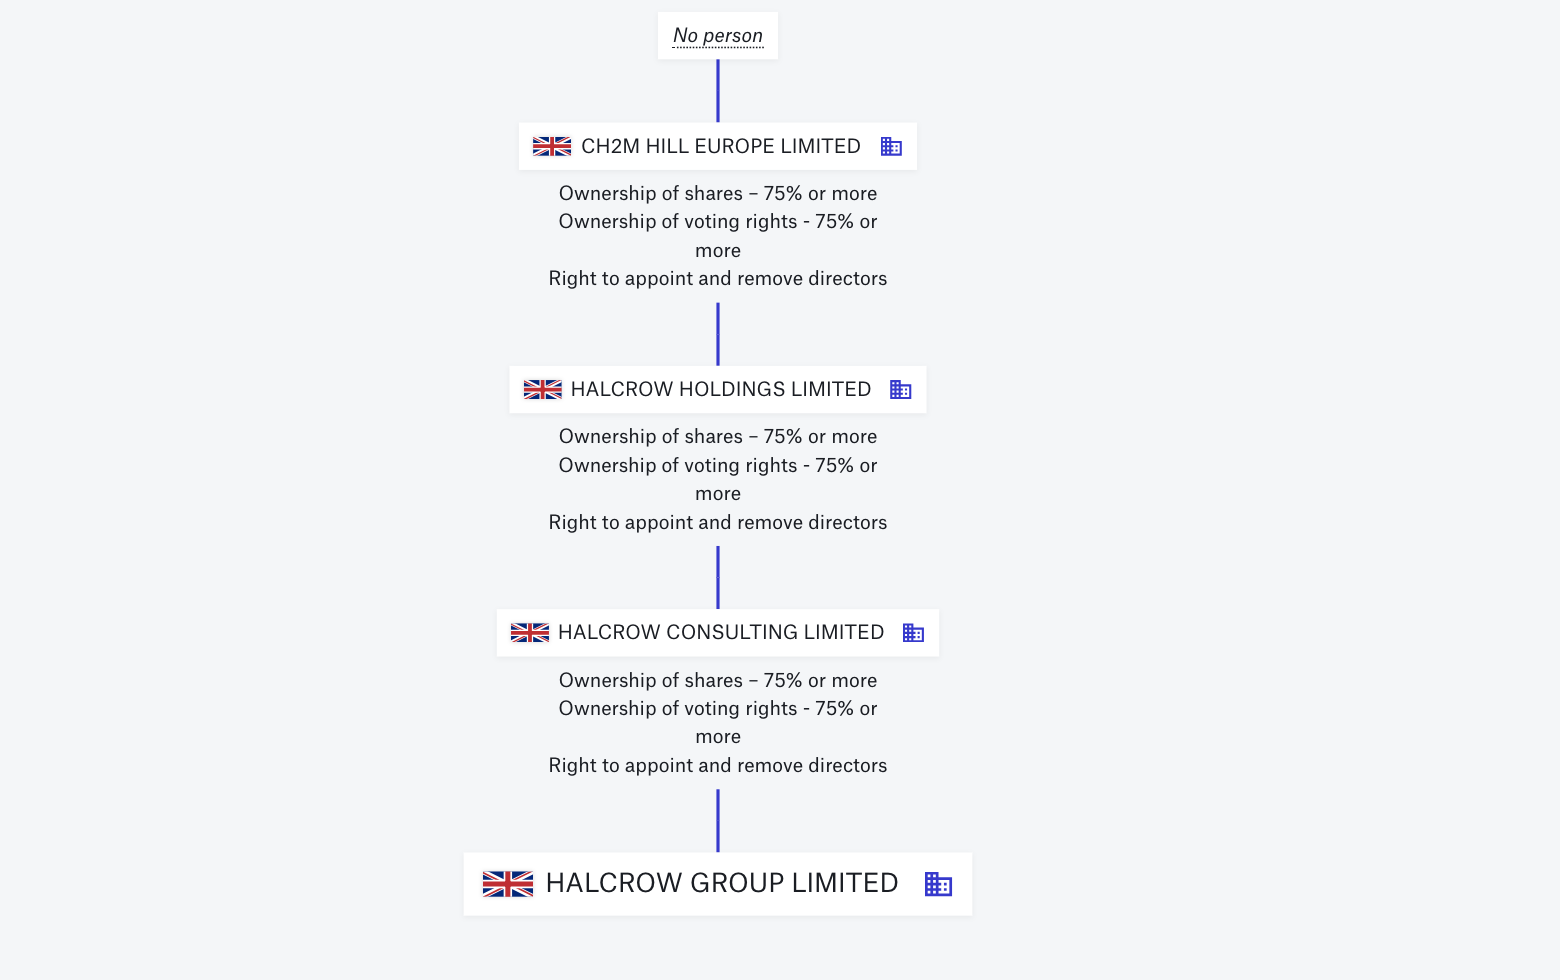
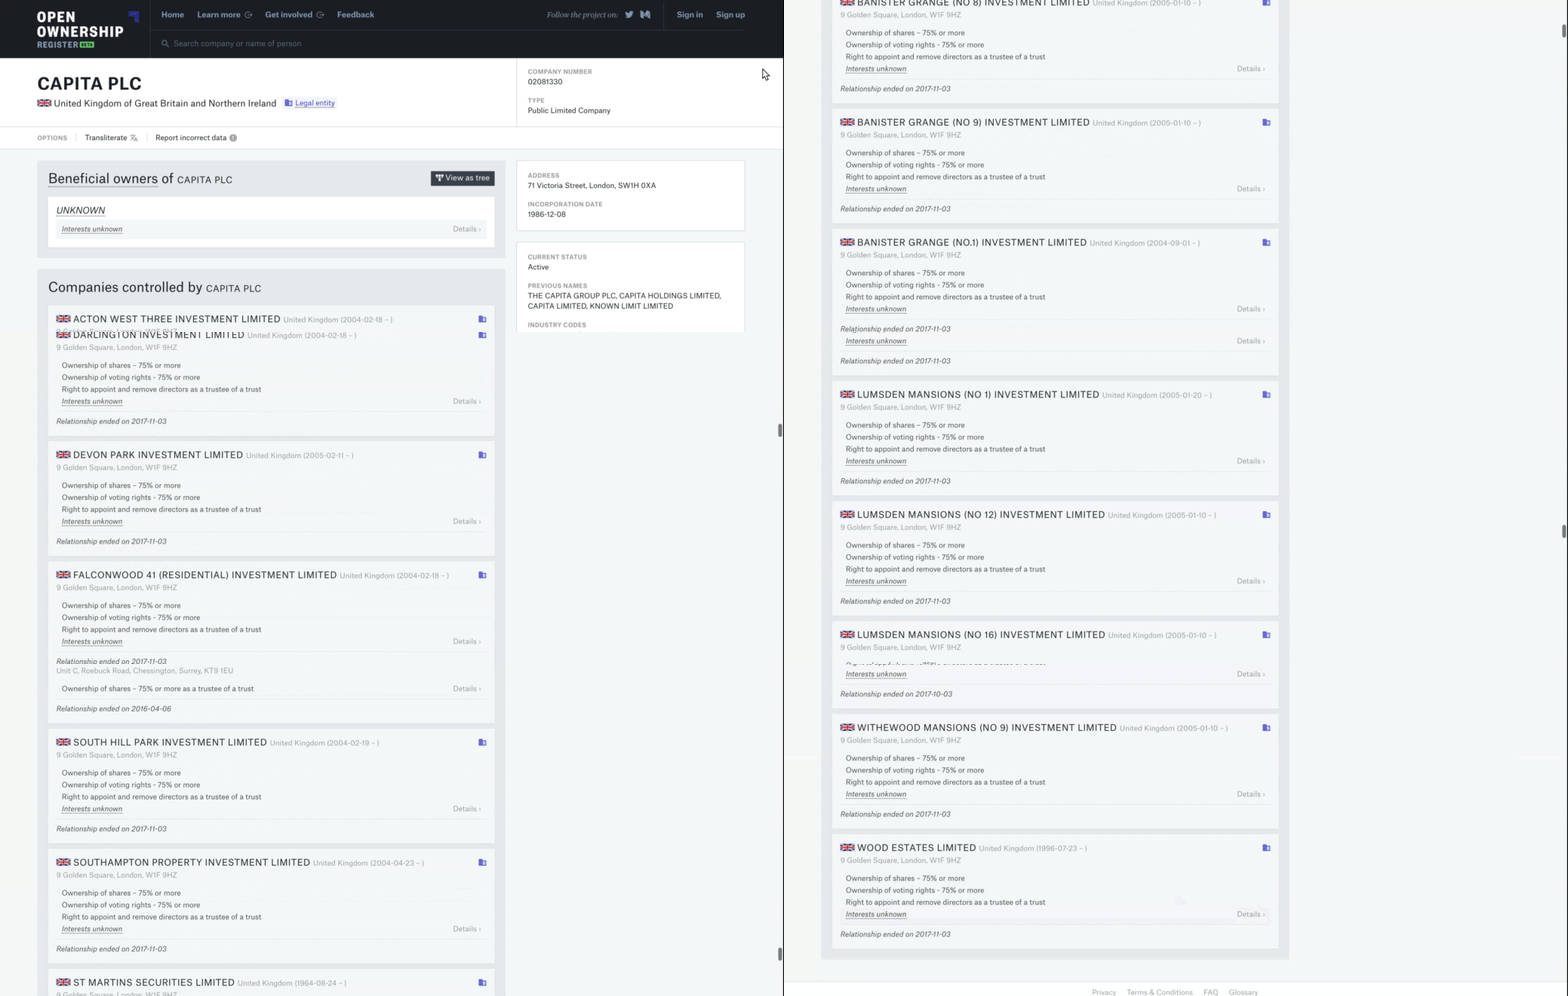
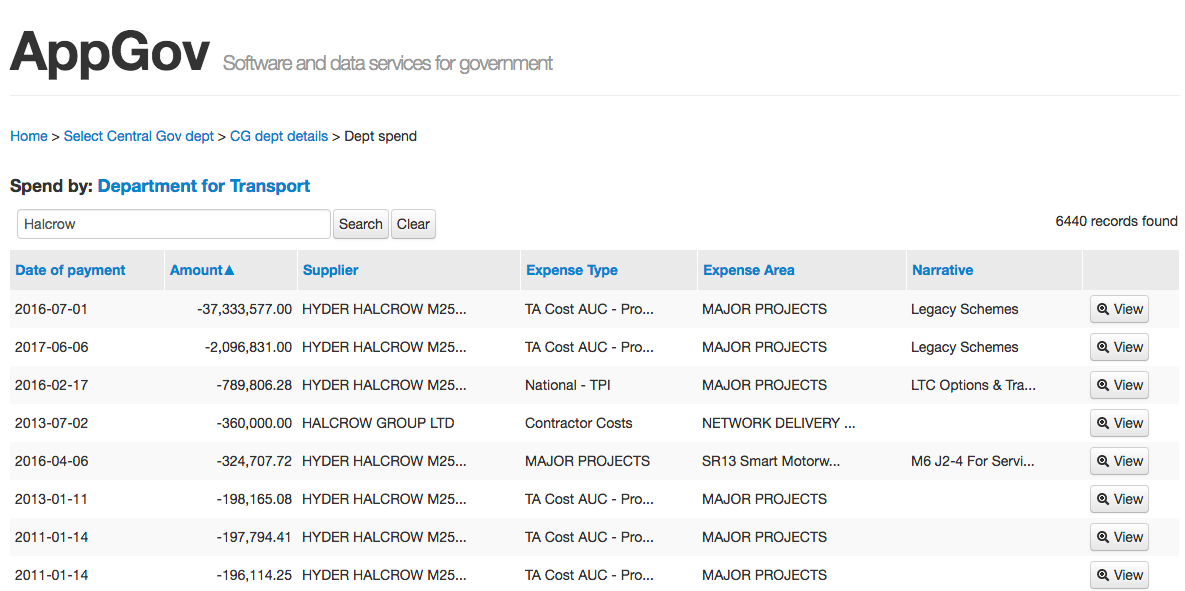
Upon further digging, our team found that there was a 10-fold increase in the number of transactions between the Government and Halcrow during a short period going up from 16 to 160. Surprisingly (and without any explanation), we also found large amounts of negative payments in July 2016 recorded. According to AppGov, a civic tech project that provides a user-friendly view on government spending, a £37,3 million negative payment was made to the Department of Transport for something related to the M25, possibly the Hyder Halcrow M25 Joint Venture. We submitted a Freedom of Information request to the Department of Transport to clarify the negative transaction. There could be a simple explanation!
An in-depth look at housing construction
One of the areas that our hack team was interested in particularly was housing. We found that when you compare a list of housing construction contractors and elected officials (councillors and politicians), many names were flagged. This dataset should be an essential part of due diligence checks by Government buyers for conflicts of interest. This Guardian investigation shows, for example, that nearly 100 London councillors have links to the property industry.
According to Contracts Finder, 700 companies won construction contracts for housing since 2017. The team tried initially to use spend data to do this analysis but found too many records were ‘redacted’ so they switched to contract award notices from Contracts Finder. Since Contracts Finder data does not have many identifiers, the company names were matched to Companies House records (via OpenCorporates) for directors and beneficial owners, revealing 695 distinct organisations and 2000 directors/beneficial owners.
Interestingly when mapping the addresses of beneficial owners and directors of housing construction contractors who have won contracts valued at £1-100 million, these are spread nicely over the whole of UK except Northern Ireland where there are none. When those who won contracts over £500 million were mapped, it clustered around the South East of England.
These are the addresses of the directors who won housing construction contracts worth 1-100 million. #DataandDealsUK pic.twitter.com/5s0csEUS43
— Open Contracting Partnership (@opencontracting) April 27, 2018
700 companies got construction contracts from @ContractsFinder. They got director addresses of these from @opencorporates. These were 2000. They mapped those that had contracts worth 500 million. All clustered around the South East. #DataandDealsUK pic.twitter.com/UvEkolA49J
— Open Contracting Partnership (@opencontracting) April 27, 2018
For such analysis to work, the two single most important data points are director and beneficial owner home addresses and company information. Both data sets are under threat. As chance would have it, as we started the last day of the event, the Government announced ‘data suppression laws’ to help company directors, secretaries, people with significant control and LLP members remove home address from publicly available company documents. At the hackathon, we used OpenCorporates API to access these records as they match Companies House data against company registers from around the world. However, not even OpenCorporates is sure how this new law applies to the existing data they have and whether they will be able to keep historical information.
The other data point is identifiers – the golden chain that allows you to identify individual organisations and to connect different datasets. Though Contracts Finder has added the field for inputting company and charity numbers, not all procurement systems (since each council and central department has a different one) have reflected it and compliance is low. When companies are mentioned, there are hardly any identifiers. This is bad news for transparency.
Turning insights into action

If the interest in our hack is anything to judge by, then businesses, civil society, and citizens are just as interested in this data as law enforcement and journalists. The insights from this data hack show the long road ahead for transforming the UK’s public procurement landscape to allow easily accessible, usable, targeted information.
The historic vote in the UK Parliament forcing Overseas Territories to publish public registers of who owns companies shows that political progress is possible. Until better identifiers and data quality checks are put in place across public procurement more generally, government and wider society are missing out on the benefits of having good quality open contracting data. The UK’s forthcoming Open Government Partnership National Action Plan would be an ideal place to commit to further improvements in accessibility, quality, and usability of both contracting and beneficial ownership data. It’s time we get better deals from better-qualified businesses.
We’re excited that people who came to the hack want to continue working on these projects so we’ll organise follow up events in the coming months. And we will be working with the civil society Open Government Working Group to push for ambitious commitments on open contracting (and better beneficial ownership information) in the UK’s new Open Government Action Plan due in July. Sign up for our slack if you want to stay in the loop!